Developing High-Level Systems to Support A Rapidly Growing Client Services Business

Overview

This business was one of the most interesting cases I’ve worked with to date. This was a thriving company that had the potential to grow at a fast pace. Its entry points to sale for clients were one of the strongest I’ve seen and they were known in their space for dominating the marketing world. 

But underneath the surface, the business had not identified key pain points that were leading to true growth. They sustained business by bringing in new. clients, but not by fostering relationships within the client services, gapping their ability to thrive and grow. Even more detrimental, is as they moved forward, their reputation started to decline, specifically because the sales were strong and other aspects of the business were weak. 

True growth does not come from the ability to sell and it doesn’t come from a decline in any aspect. It has to be defined that everything builds and layers on top of each other – employees, clients, revenue, profit margins, and sustained services. To break this down at the root, this needs to be defined through an output metric that then takes into account the other aspects within the business. At the base level for this company, it was looking at revenue that drives upward (vs staying the same), increases in the book of business, and decreases in churn. Their formula to growth was based on the relationship of these three factors. For any service-based business, there is a deep relationship between sales, services, and churn ratios, causing the main identifiers to success relating to high-level systems and deliverables that support the customer relationship. 

Analyzing and Targeting the Deepest Issues

When I walked into this business, the churn ratio for the company was an average of 30% per quarter, a high amount where there was an influx of sales specifically to support the amount of people walking out the door. The average churn rate per client services should be an average of 1-5% , with the amount of time to offboard being at 2-3 years, vs. the 6 – 9 month average of this company. This highlighted that this particular business had deep issues with how it looked at its services and processes. 

When walking into this position, the issues were transparent. 

* Services were held by relationship and not by deliverable

* Operational systems were either not present or were breakable

* The expectations of team members were nebulous and lacked in transparency

* There wasn’t a deeper or higher-level set of systems that were set up through the company, causing most of the clients to offboard within 6- 9 months. 

The Strategy to Operations Intertwine

In many instances, I can walk into a business, audit, and identify specific strategies that need to roll out. High-level roadmaps that are defined through a combination of data and daily activities will lead to better results. Any strategic transformation begins with looking at quantifiable information and uniting it with qualitative data from the surrounding environment. 

Many executives believe that cutting out everything but drier business tactics is the best approach. Every audit where I’ve combined qualitative data speaks otherwise. If a process or strategy is incorrect, it causes burnout, disempowerment, disgruntled employees, and stress. It always matches with a data-driven pain point and a gap within a system. 

There is never a difference in measurements between data, human elements, and processes. Strategy is united with everything and requires a holistic view to truly understand and resolve the issues that are taking place. Any executive that denies this viewpoint is stopping their business from being able to accelerate results. 

When looking at and absorbing the information of this company, it was found that there was a relationship between the stress of employees, the lack of operational processes, and a gap in strategic company initiatives that were not allowing the department to drive forward. 

Starting with Process

To unravel this particular world filled with opportunity, it meant starting from the bottom up and undoing the elements that caused human stress  through process. Finding places where there was an undeniable lack of valuable services led to targeting reasons for client churn as well as reasons for employee dissatisfaction. It was apparent through this first stage that deliverables, employee processes, and client dissatisfaction were intertwined. 

To begin the process, everything was broken down to a why. In the past, there was a focus on if someone churns, then make another sale. In this instance, it turned into if someone churns – learn the defining reasons and fix those reasons until they no longer exist. This allowed us to look at the processes, employee relationships, and missing deliverables. 

Developing Deliverable Standards: The company had base-level deliverables that were required at a production level. But, it lacked high-level and value-added deliverables. Because of this, any production-level issues that arose had no backbone to support or compensate for those issues. As a Phase 1, deliverables that focused on strategic initiatives were built and templatized as playbooks to identify what someone should be doing and how this inter-related with the client interactions. 

Each of the representations below highlight playbook initiatives. Each included strategic approaches to each employee. For example, if we identiified that a client was at a foundational level, we would use playbooks that then built out deliverables and strategies to support the client. This streamlined how we spoke to clients, deliverables expected, and offered high-level strategies as well as value adds to those that were associated with the company. 


Sample Strategic Playbooks

Standardizing Processes: The production-level issues didn’t go away with the additional deliverables. But, new standardizations and processes were put into place to support better productivity. This included looking at the project management tools in place, adding in new levels of understanding with what roles included, rolling out performance reviews, and giving definition to the expected processes in place. 

The first stage of this included testing project trackers while ensuring that all information became transparent and noticed by the employees, employers, and the clients. 


Sample Project Tracker

Changing Employee Standards + Happiness: When initially starting with this company, they were known for their cool hip vibe and winning clients over just through charisma. But, it was altered with the expectation that employees’ didn’t need to work as hard because the manager would do it for them. In fact, employees didn’t have job roles defined or understand what they needed to do. This led to poor performance and specific issues with employee attitude. By standardizing deliverables as well as processes, rigidity started to arise which was just as damaging and even more toxic with the wrong management standards in place. Compensating for this was as simple as setting processes in place that supported employee performance as a standard of happiness. Reward systems, positive reinforcement, coaching, workshops, and other initiatives were put into motion as a process to support both high standards and employee happiness. 

Phase 1 Results

The rollout of new standards began in Q3 and were fully implemented in Jan – April of the next year, changing the processes for employees 10 clients at a time. As can be seen from the above chart, this cut the churn rate in half, showing the interrelationship between the deliverables, employee direction, and client satisfaction. 

This highlights that there was a reduction based on these initial strategic roll-outs that supported the development of the company, levels of client satisfaction, and which began to create a relationship between sales and sustainability for true growth.   

Building Toward Sustainability

The association I always have when troubleshooting and working toward strategic transformation is to create sustainability. Often, I see leaders work on execution only. “I need this done, will you go and do it.” And once that task is complete, it ends and fades away. The only way to create sustainability is to place things in an order that passes down from one leader to the next, allowing them to add on and evolve but to maintain the central shape within the company. 

The second phase for this particular company was to take the things we learned that worked and to build out effective sustainability. To do so, there was recognition that the current operational approaches were not effective in creating transparency or consistency. This moved into processes and systems that targeted each of the individuals’ and their defined roles. With those roles, as well as SOPs put in place, there was the ability to identify gaps and have specific ways to analyze and look at where churn was taking place at. 

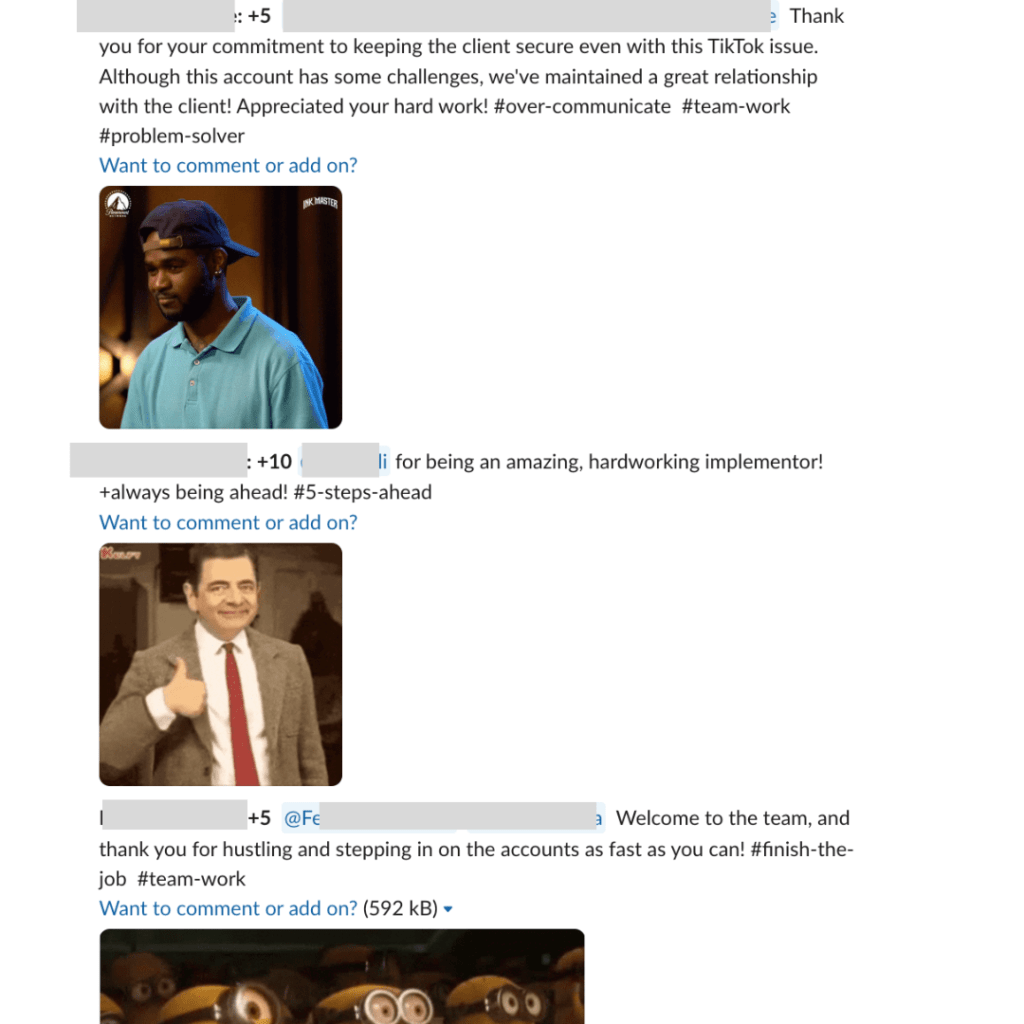
Defining Management Systems: The management systems were relooked by moving out of a base-level platform and into task management. This was done during phase 1 as a “test” which then impacted moving into a new platform and igniting task-oriented performance vs. higher-level expectations. As a result, each individual had the ability to have designated bandwidth per task as well as specific ways to improve their job. The process and orientation of this took over the expectation that everyone would come to work and do their job. This was followed by deeper management systems, including hubs to hold information for clients and create transparency as well as support systems through squads that ensured performance didn’t drop. 

Standardization and Training: A lack of descriptions and understanding of what was supposed to take place in each role was one of the largest reasons for churn. An interesting response took place by employees when the new project management system rolled out. No one knew what to do. No one understood the process or system or what was supposed to take place. As a result, there was a 60% employee churn rate as well as a loss of clients from the high amount of change within the organization. The lack of risk mitigation which took place by the company to change their system led to a need to retract and rework what was done. To redefine this, a series of SOPs and training materials were put into place, allowing each individual to have clear day-to-day expectations and to understand how they were coming into their job to perform. 

New Employee Expectations: In association with the ability to work with streamlined systems was also the ability to continue to support the growth of employees’ in the workforce. The roll-out of Paths to Growth as well as support systems were created to highlight performance measures as the main motivation while creating clear expectations about what one should do within the organization to thrive.  This allowed those who were in the management system to have a place to shine and to build out a space within the company that combined both standardization with the uniqueness that each employee has the potential of building. 

Sample SOP
Sample Path to Growth
Central Data System for Clients

Finalizing the Strategic Transformation

Remember how Q2 saw a decline by 50% in the churn rate? Bring that to the total of 2023 when this work was done. The light blue was the department in which all changes were made. You can see the decline after those changes are made, slightly spiking when the employees were lost in September. 

This shows how there is a deep relationship between processes, employees, and the delivery of services. The unmitigated role out of the new management system directly impacted the revenue that took place, causing churn of employees to directly impact the relationship to the clients. In 2024, the decline with churn occurred again, reducing the churn rate in Q1 to 3%, the lowest rate that the company had ever seen. 

Putting the SOPs in place and standardizing the deliverables caused the return to lower churn rates. Continuing to optimize the strategic deliverables that had been set in motion assisted the company and allowed them to leverage the foundation that was built while highlighting continued growth by churn reduction. 

Another interesting change took place with this strategic transformation was based on the churn reason. In the past, the reason for churn was based on services and not being happy with what was taking place. In this instance, there was a direct correlation with the changes that took place in the company as well as the results that the clients felt from this. 

The most important measurement with this is to look at the churn rate from the year before and to compare it to the transformational changes and how this fell in Q1 of the next year. This defines exactly how much of the process was effective, minus the change management that was not mitigated within Q4 of the previous year. 

This percentage decline is exactly where we want to be. In Q1, which for this business is expected to be the highest churn rate months, decreased by 50% in all except March. The second 50% decline that took place, resulted from the strategic transformation that was put into play across the processes, operations, and the new approach to employee health. 

More importantly, every reason for the churn that took place in Q1 was related specifically to finances with the surveys and NPS scores having deeper value to the team partnerships, strategic presentations, and deliverables. This highlighted a significant change within the company and supported the ideologies of building a holistic relationship to increase profitability and to drive revenue.

Key Learnings

Strategic Opportunities are Holistic

Wouldn’t it be nice if we could look at revenue and state that we need to boost revenue? But that goal is not achievable without having key components place. Developing the strategic transformation included auditing the strategy of deliverables, processes, and the relationship between team members and clients. Yes, it was driven by pieces of data and the bottom line within the business, but all factors were considered to make the most impact. This impacted the results with both positive and negative results. 

Define and Transform Key Pain Points

What does it take to define pain points? It means that each issue needs to be resolved together and create the results that are truly desired. In this instance, the churn reduction percentages served as the output, or final result, for sustainability and growth. It was specific areas of process and functionality that led to these results working. Being able to build high-level layers into the process helped to refine the results desired. 

Strategy Triumphs Over All

What was the key change that made the difference? It was the relationship to deliverables that took place in the first phase of this process. And in that approach, it was focusing on delivering strategic results and lead roadmaps to clients. It showed investment in the services and allowed clients to see thoughtfulness and partnership as core values.  Developing everything else to support this central concept also ignited the other components to come in and support the development. I suspect that the use of each of these factions will support and drive results, allowing the business to move into true growth.

Leave a Comment

Your email address will not be published. Required fields are marked *